See next month's demand, with an honest range around it.
Two forecasts for the next four weeks: a moving average and a pretrained forecasting model that also gives a likely range. Both are drawn against actual sales.
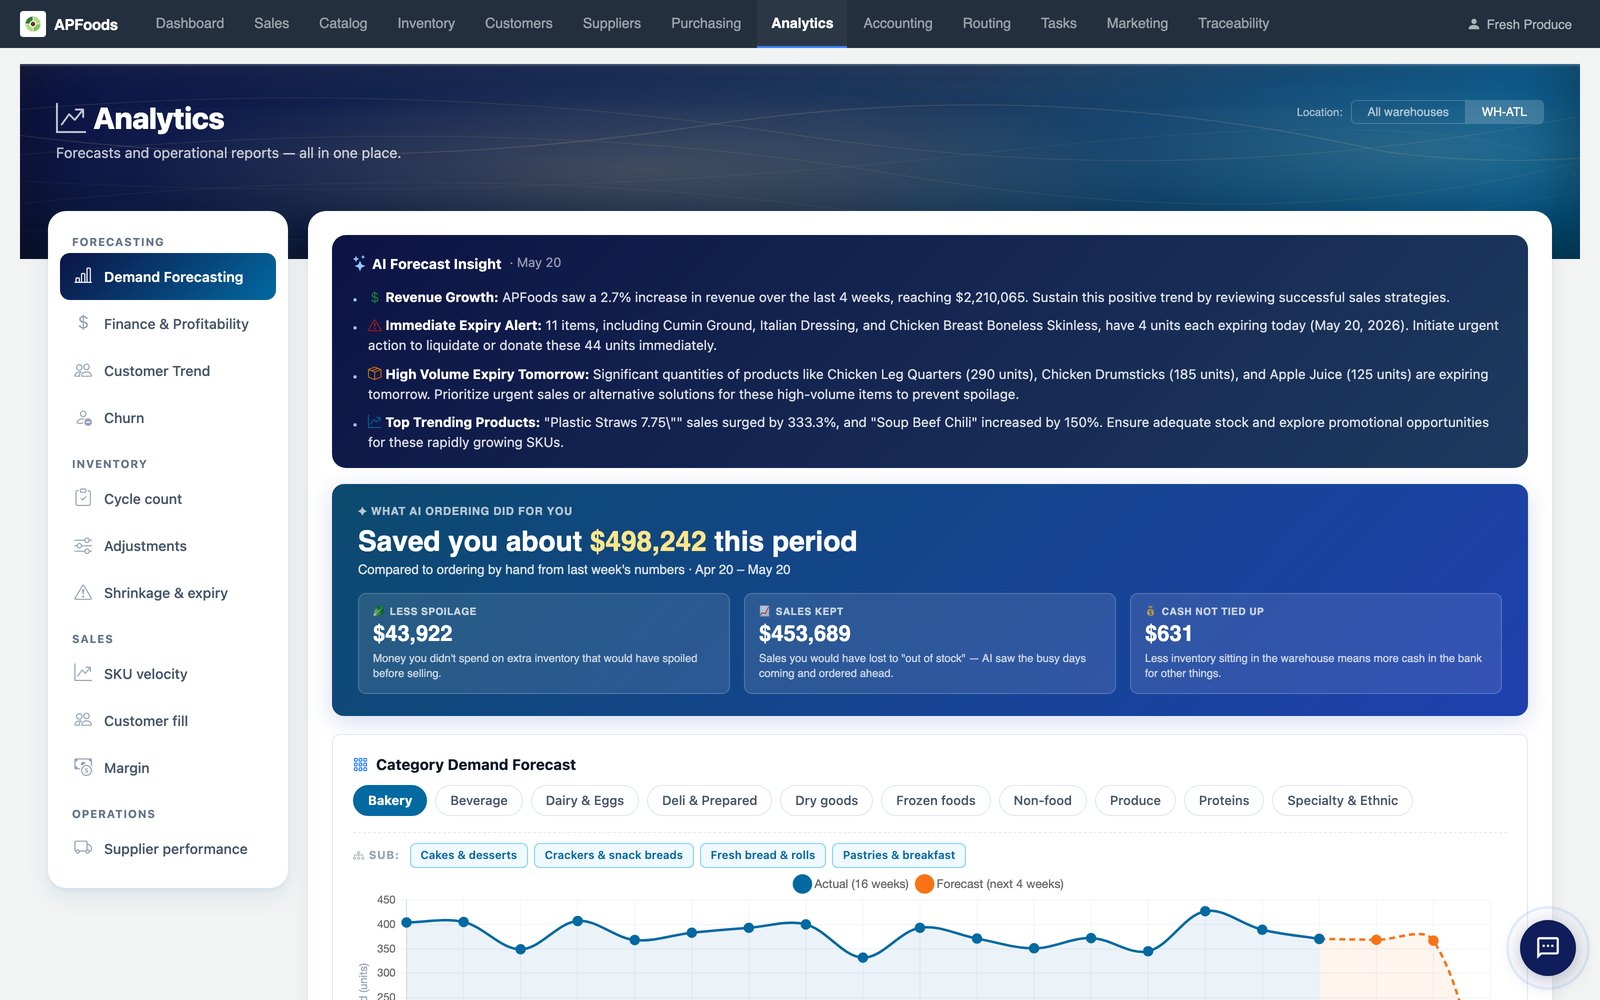
What is in forecasting.
Two methods
A moving average and a pretrained forecasting model, side by side.
A likely range
The model gives a likely value and a band that shows how sure it is.
Every level
Item, subcategory, category, whole warehouse and all warehouses, each forecast as its own series.
Four weeks ahead
Refreshed on a schedule from your weekly sales history.
Bags fold into cases
Partial-case sales are counted in the case they came from.
Dashboard
Demand chart, customer trends, at-risk customers and a daily summary.
Demand forecasting: questions we are asked.
What is the forecasting model?
A pretrained time-series forecasting model. APFoodz does not train a model on your data.
How accurate is it?
It depends on the item and how much history it has. The range shows how sure the forecast is; a wide band means plan for either end.
Terms on this page
Demand forecasting works with
See it with your own data.
A working session on your own items, customers and route days. Thirty minutes.
Get a demo